For the last 24 hours, Polkadot (DOT) was down by 3.65% and trading at $15.85, with a trading volume of $1,414,486,745. Its market capitalisation stands at $15,475,251,379, thus ranks it as the 9th largest cryptocurrency. The trading volume demonstrates that DOT is one of the major cryptocurrencies currently doing well in the market. 
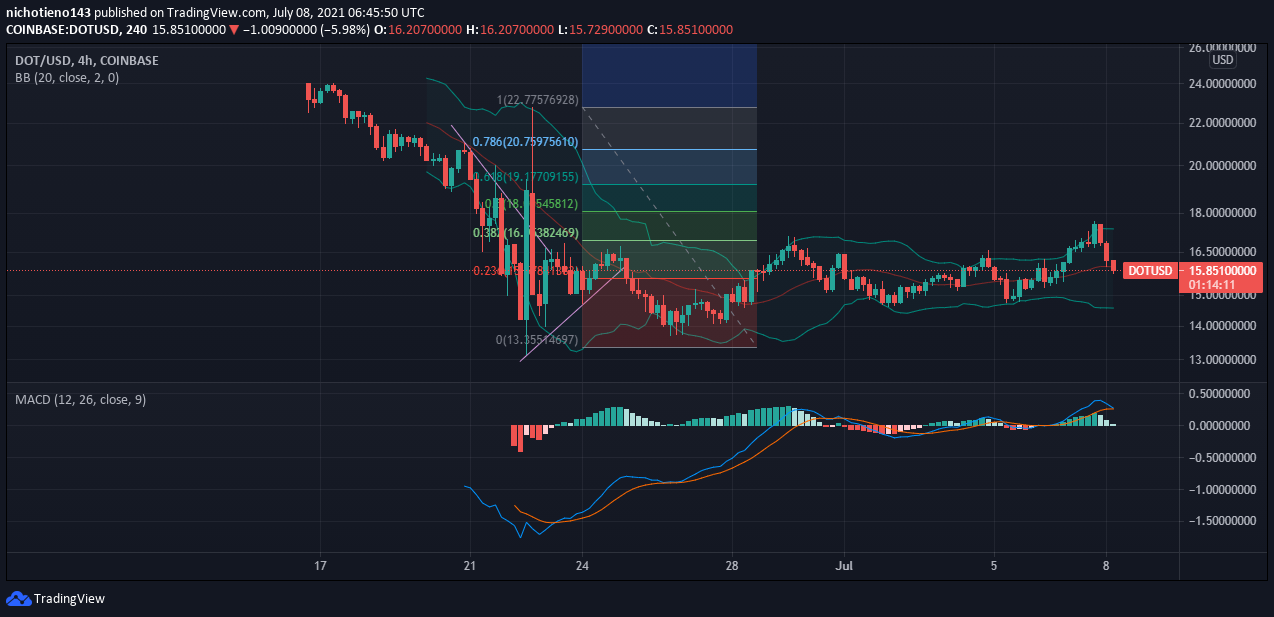
The 4-hour DOT/USD on Coinbase exchange shows a wedge chart at the end of the downward trend and shows a rejection of a bear market where candlesticks failed attempts to continue the downward trend. Still, a correction (consolidation) phase is formed.
While the presence of short candlesticks signals that Polkadot is in the consolidation phase, the presence of a pin bar candlestick indicates a potential sell-off where the existing trend (consolidation phase) is coming to an end. Therefore a downward trend is likely to occur (as the interest to sell increases and the buyers appear to fail to get the upward trend to work).
The MACD lines further confirmed the consolidation phase, showing that DOT has been in the sideways phase since June 21, as indicated by the lines converging and moving alongside the 0-level. But the sideways trend appeared to have changed since July 6, as the MACD lines moved above the 0-level, showing that the crypto is in an upward trend.
However, the Bollinger bands indicator signals a weak trend as the outer bands’ contract and price move in the middle. Besides that, since yesterday, the outer bands seem to widen, thus signalling the prices of Polkadot likely to experience a slow upward and downward trend, thus confirming a likelihood of continuation of the consolidation phase.
Polkadot began this year with a trading price of $9.12 at the beginning of January. With certain changes, the DOT started to grow further. As a result, the token took all measures targeting its $50 area. In mid-May, the crypto hit $42.98 and afterwards plunged into a bearish trap on May 19 when the entire crypto market crashed and lost about 50% of value. Polkadot is currently resuming its trading and is rising slowly from its low levels.
Just like all other crypto assets, Polkadot is subject to a series of unique market drivers, such as uncertainties taking place currently, including government regulations, crypto mining concerns, hacking, fraud, litigation, corporate rumours, and others.
But DOT is unique from other cryptocurrencies because of its financial resources. Since its inception in 2017, Polkadot has raised about $200 million from investors through multiple coin offerings and crowdfunding. As a result, DOT ranks among the well-funded blockchain startups in history.
The popularity of Polkadot remains as its blockchain project aims to decentralise the web by connecting blockchains and allowing them to interact, which is enabling new applications such as certain decentralised finance (DeFi) services.
A likelihood of a sell-off as signalled by the presence of a pin bar can be invalidated by the MACD indicators showing a possibility of a slow uptrend, Bollinger bands indicators signalling a likelihood of the consolidation phase to continue, and the wedge chart confirms the sideways phase. The Fibonacci retracement indicator signals that Polkadot may consolidate between the $13.35 support zone and the $16.98 resistance zone.
Image source: Shutterstock